Edit chart
Loading graph
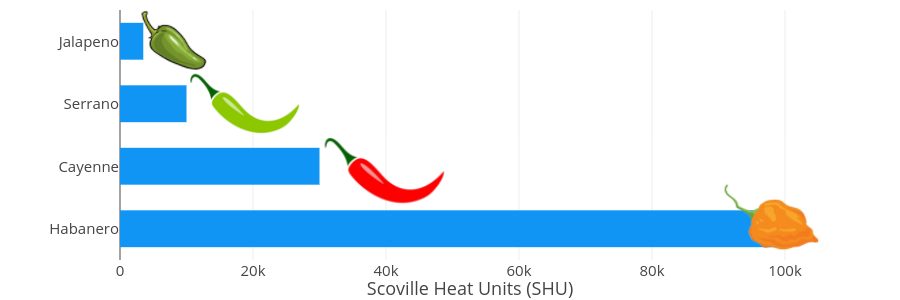
Aar6on67's interactive graph and data of "y" is a bar chart, showing y; with Scoville Heat Units (SHU) in the x-axis. The x-axis shows values from 0 to 105263.15789473684. The y-axis shows values from -0.5 to 3.5.